Zur Startseite Zur Hauptnavigation Zum Inhalt Zur Sitemap
+A-
ENDE
  menu
AG Biomolekulare Photonik
  menu
  • Staff
  • How to find us in Jena?
  • Research
  • Methods
    • Laser scanning microscopy
    • Fluorescence lifetime measurements
      • TCSPC
      • Streak Camera
    • Patch-clamp technique
    • Patch-Clamp Fluorometry
  • Teaching
  • Open Positions
  • Contact Information
  • Main menu
    • Patients & Relatives
    • Research
    • Teaching and study
    • Doctors & Referrers
    • Clinics & Institutes
    • University Hospital
  • Staff
  • How to find us in Jena?
  • Research
  • Methods
    • Laser scanning microscopy
    • Fluorescence lifetime measurements
      • TCSPC
      • Streak Camera
    • Patch-clamp technique
    • Patch-Clamp Fluorometry
  • Teaching
  • Open Positions
  • Contact Information
Homepage Biomolecular Photonics Group / Methods / Fluorescence lifetime measurements / Streak Camera

Streak Camera

Beam path

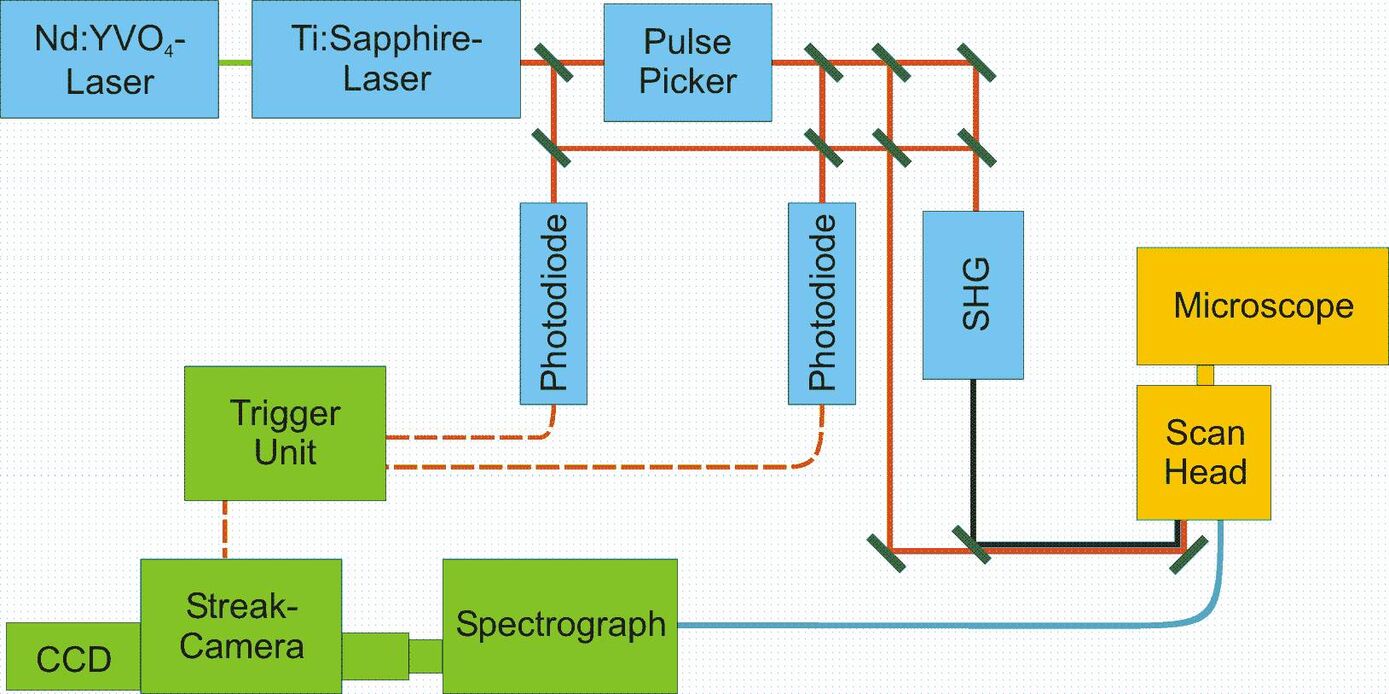
In order to be able to acquire time-resolved fluorescence spectra from cellular compartments of living cells, we adapted a spectrograph and a streak camera to a confocal laser scanning microscope (LSM 510, Carl Zeiss GmbH, Göttingen, Germany). For fluorescence excitation we used a femtosecond Ti:Sapphire laser, whose repetition rate is decreased to 2 MHz by a pulse picker (Fig. 1).

Figure 1: Beam path. For pulsed excitation of the sample a Ti:Sapphire laser (Mira 900, Coherent), pumped by a frequency doubled NdYVO4-laser (Verdi 5 W, Coherent) is used. A pulse picker decreases the repetition rate to 2 MHz. The frequency of the laser light can be doubled by a BBO crystal. Fluorescence emitted by the sample is guided to a spectrograph (250is, Chromex Inc., Albuquerque) and a Hamamatsu streak camera (C5680, with M5677 sweep unit). (Fig. reproduced from: Biskup et al., Nat. Biotechnol. 22, 220-224 (2004))

Operation principle

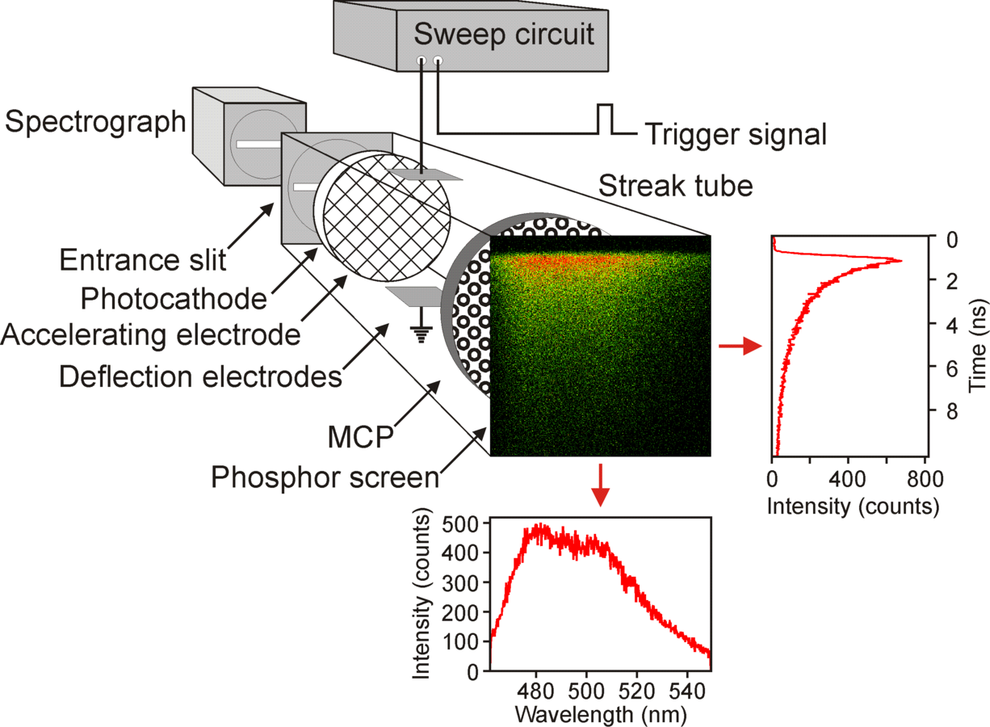
Figure 2 explains the operation principle of a streak camera. The light pulse to be measured is focused onto the photocathode of the streak tube, where photons are converted into electrons. The photoelectrons are accelerated by the accelerating electrode, pass through a pair of deflection plates, are multiplied in a micro-channel plate (MCP), and hit the phosphor screen of the streak tube, where they are reconverted into an optical image, the so-called streak image. At the instant the photoelectrons pass through the deflection electrodes a voltage ramp is applied so that the electrons are swept from top to bottom. Electrons leaving the photocathode at earlier times arrive at the phosphor screen at a position close to the top of the screen, while those electrons that leave the photocathode at later times arrive at a position closer to the bottom of the screen. Hence, the time at which the photoelectrons left the photocathode can be determined by their vertical position in the streak image. The horizontal position of the photoelectron depends on the wavelength, because a spectrograph was used to focus the spectrum onto the photocathode.

Figure 2: Operation principle of a streak camera. See text for details. (Fig. reproduced from: Biskup et al., Nat. Biotechnol. 22, 220-224 (2004))
Analysis of streak images

This setup takes benefit from both the high spatial resolution of the laser scanning microscope and the high temporal resolution of the streak camera, allowing measuring both the emission spectra and the corresponding fluorescence lifetimes in a small confocal volume.

From a streak image both the fluorescence spectrum as well as the fluorescence decay can be derived. This is demonstrated by Fig. 3, which shows a streak image obtained from a HEK293 cell expressing CFP as a cytosolic protein. By summing up fluorescence intensities along the time axis (vertical axis) and plotting the resulting intensities versus the wavelength (horizontal axis) the fluorescence spectrum can be calculated. The fluorescence decay curve is extracted from the streak image by summing up the fluorescence intensities in the wavelength band of interest and plotting the resulting intensities versus the time axis. The fluorescence lifetime of the fluorophore can be derived by fitting an exponential function to this histogram.

Figure 3: Analysis of streak images.

Staff Teaching
How to find us in Jena? Open Positions
Research Contact Information
Methods
Impressum
Datenschutz
FSU
VUD